Using the services - Web maps
This section describes how to use our services in maps embedded on web pages. A reasonable understanding of Javascript is assumed.
OpenLayers
OpenLayers is a JavaScript library which allows dynamic maps to be added to any web page. Our examples page shows various ways how our services can be used with OpenLayers (version 5.3.0). The OpenLayers examples are also a great way to learn about creating web maps, along with the OpenLayers documentation.
Adding copyright
All of our layers must always have the relevant copyright displayed on the maps.
You can use the attributions property in the ol.source class. Using this method requires you to set the correct copyright for the layer you are using. These are given in the legal section.
OpenLayers Attribution Example
new ol.source.TileWMS({
	url: '/basemaps/wms?',
	params: {'LAYERS': 'topobasemap', 'TILED': true, 'FORMAT': 'image/png', 'VERSION': '1.1.1'},
	serverType: 'mapserver',
	attributions: ['© Landcare Research NZ Limited 2009-. Contains data sourced from LINZ. Crown Copyright Reserved.']
});
Leaflet
Leaflet is an easy-to-use JavaScript library for mobile-friendly interactive maps. See here for examples of using our services within Leaflet.
Adding copyright
All of our layers must always have the relevant copyright displayed on the maps.
You can use the attribution control to achieve this in Leaflet. Using this method requires you to set the correct copyright for the layer you are using. These are given in the legal section.
Leaflet Attribution Example
var map = L.map('map');
map.attributionControl.addAttribution('© Landcare Research NZ Limited 2009-. Contains data sourced from LINZ. Crown Copyright Reserved.');
Google Maps
The Google Maps API allows developers to add Google maps to their website. Landcare Research's (cached & uncached) WMS layers can be included in these maps relatively simply. All layers are available in EPSG:3857 / EPSG:900913 (Spherical Mercator) projection through our cached and uncached services. Check the section for projection support. The cached layers that are available can be accessed using the Google Maps XYZ Tile Service specification, an example of which can be found on the examples page.
OpenLayers Attribution Example
new ol.layer.Tile({
  source: new ol.source.XYZ({
    url: '/cached/gmaps/lri_observed_erosion@GoogleMapsCompatible/{z}/{x}/{y}.png'
  })
});
Mapbox GL JS
Mapbox GL JS is a JavaScript library that uses WebGL to render interactive maps from vector tiles and Mapbox styles.
Adding copyright
All of our layers must always have the relevant copyright displayed on the maps.
You can use the AttributionControl to achieve this in Mapbox. Using this method requires you to set the correct copyright for the layer you are using. These are given in the legal section.
Using the services - Desktop GIS
This section describes how to use our services in desktop GIS applications, such as Quantum GIS, ESRI's ArcMap, or uDig. While every endeavour is made to keep these instructions up to date, there may be slight differences to the software you are using, depending on which version you are using, and the operating system you are running it on. Please refer to the software's user manual in the first instance if you encounter issues. Alternatively, please contact us at lris_support@landcareresearch.co.nz.
With Quantum GIS
Quantum GIS (QGIS) is an open source desktop GIS. The instructions below were created using QGIS 3.4.3 on Mac OS X, however steps will be very similar to using QGIS on Microsoft Windows.
To add a WMS/WMTS layer to QGIS:
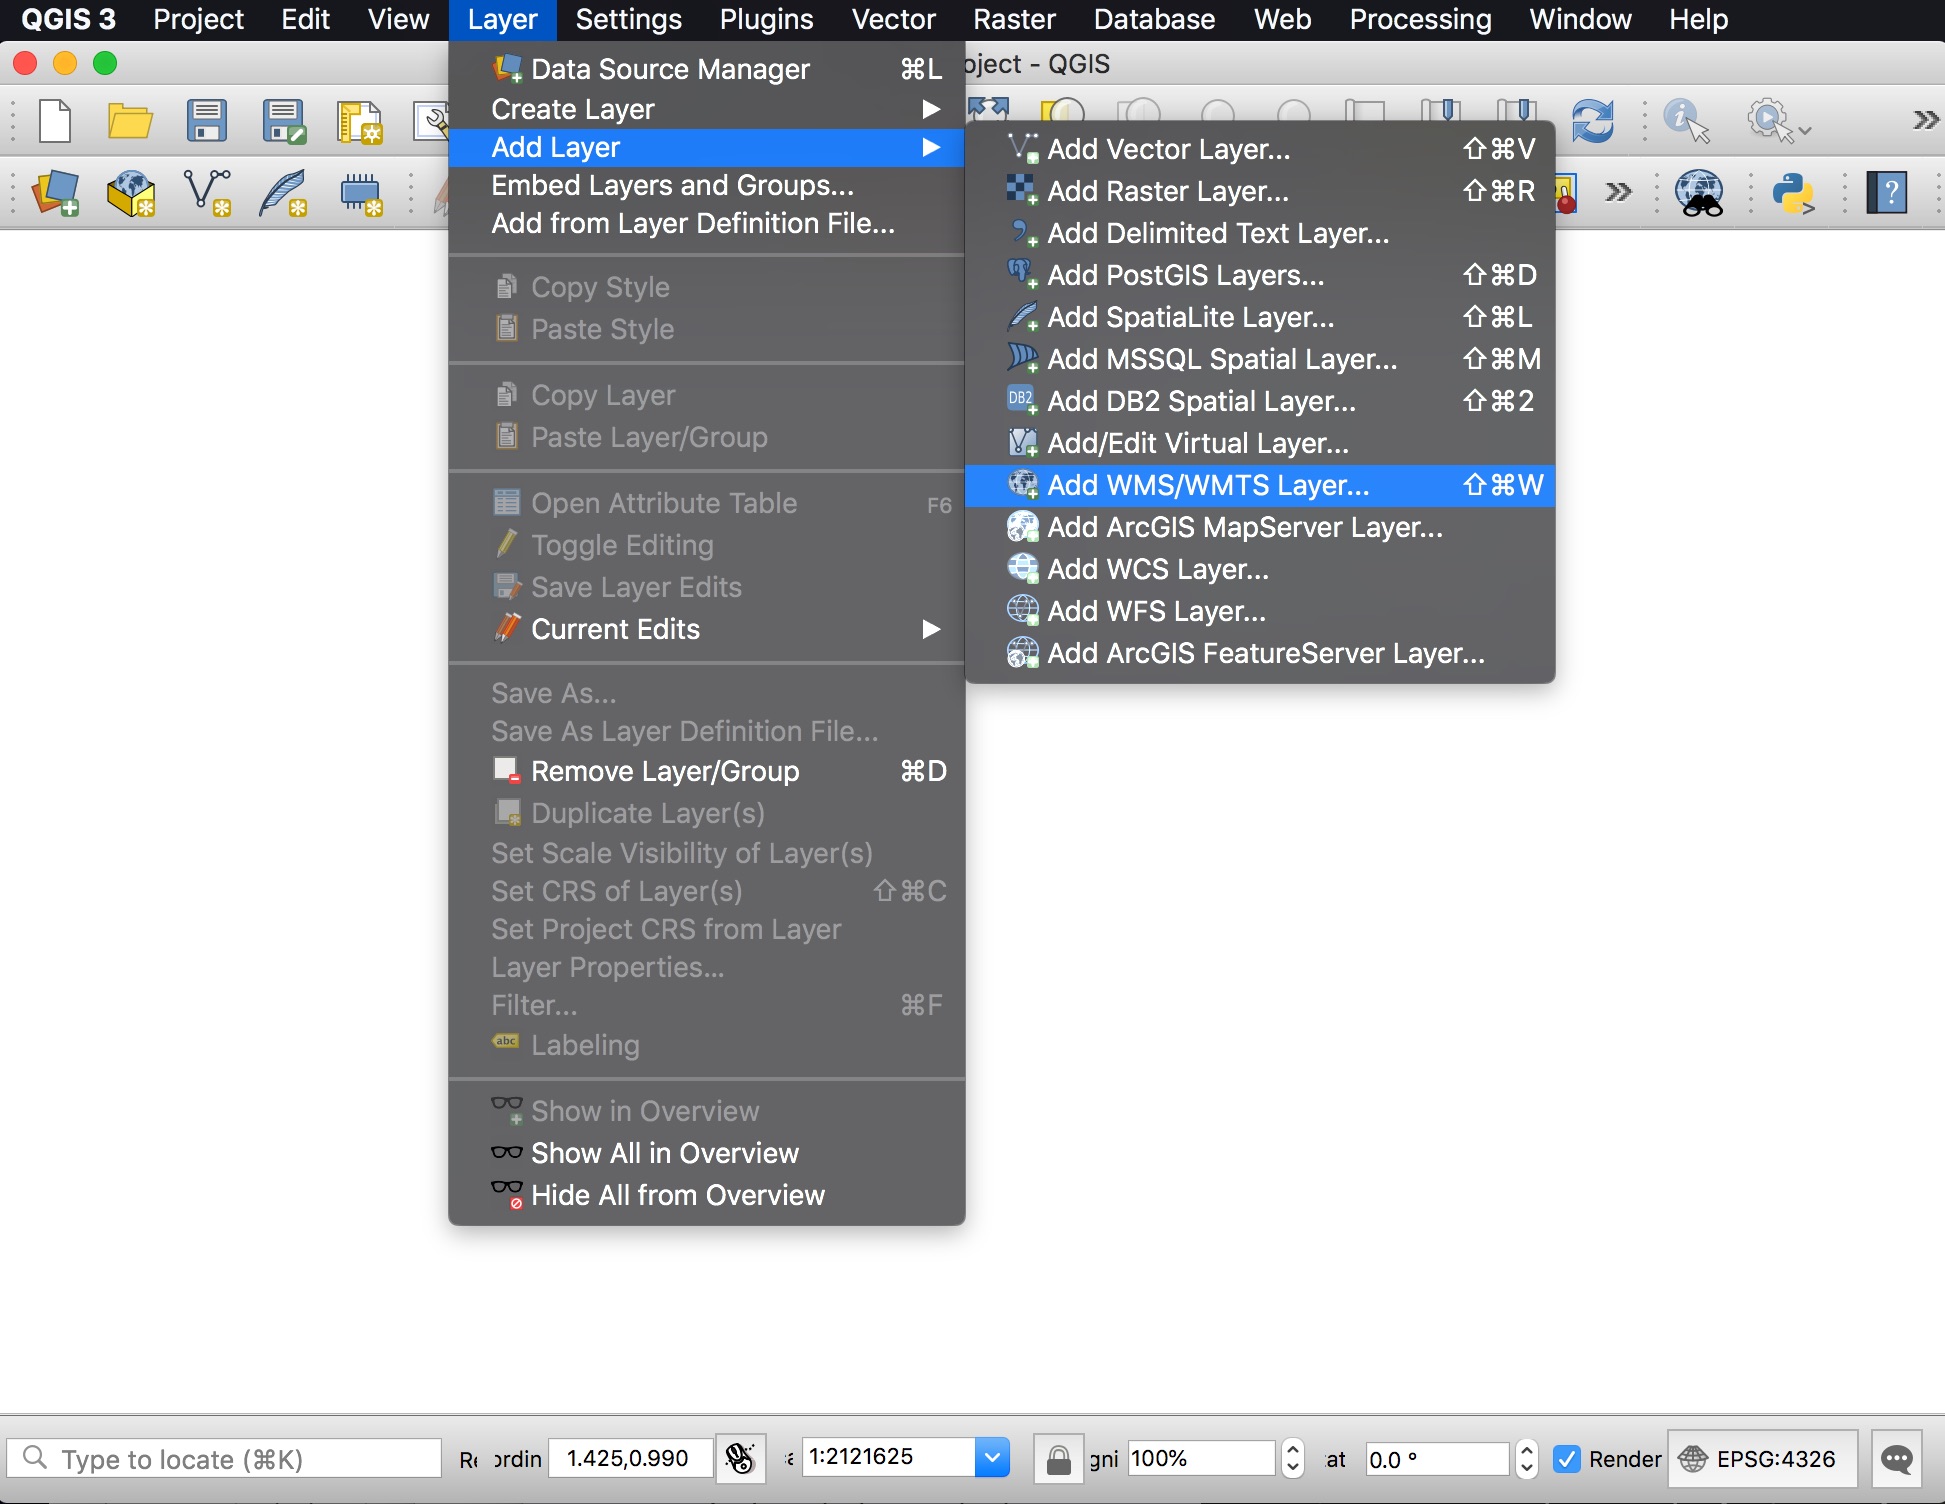
- Open QGIS, navigate to the 'Layer' menu, choose 'Add Layer', then the 'Add WMS/WMTS Layer' option.
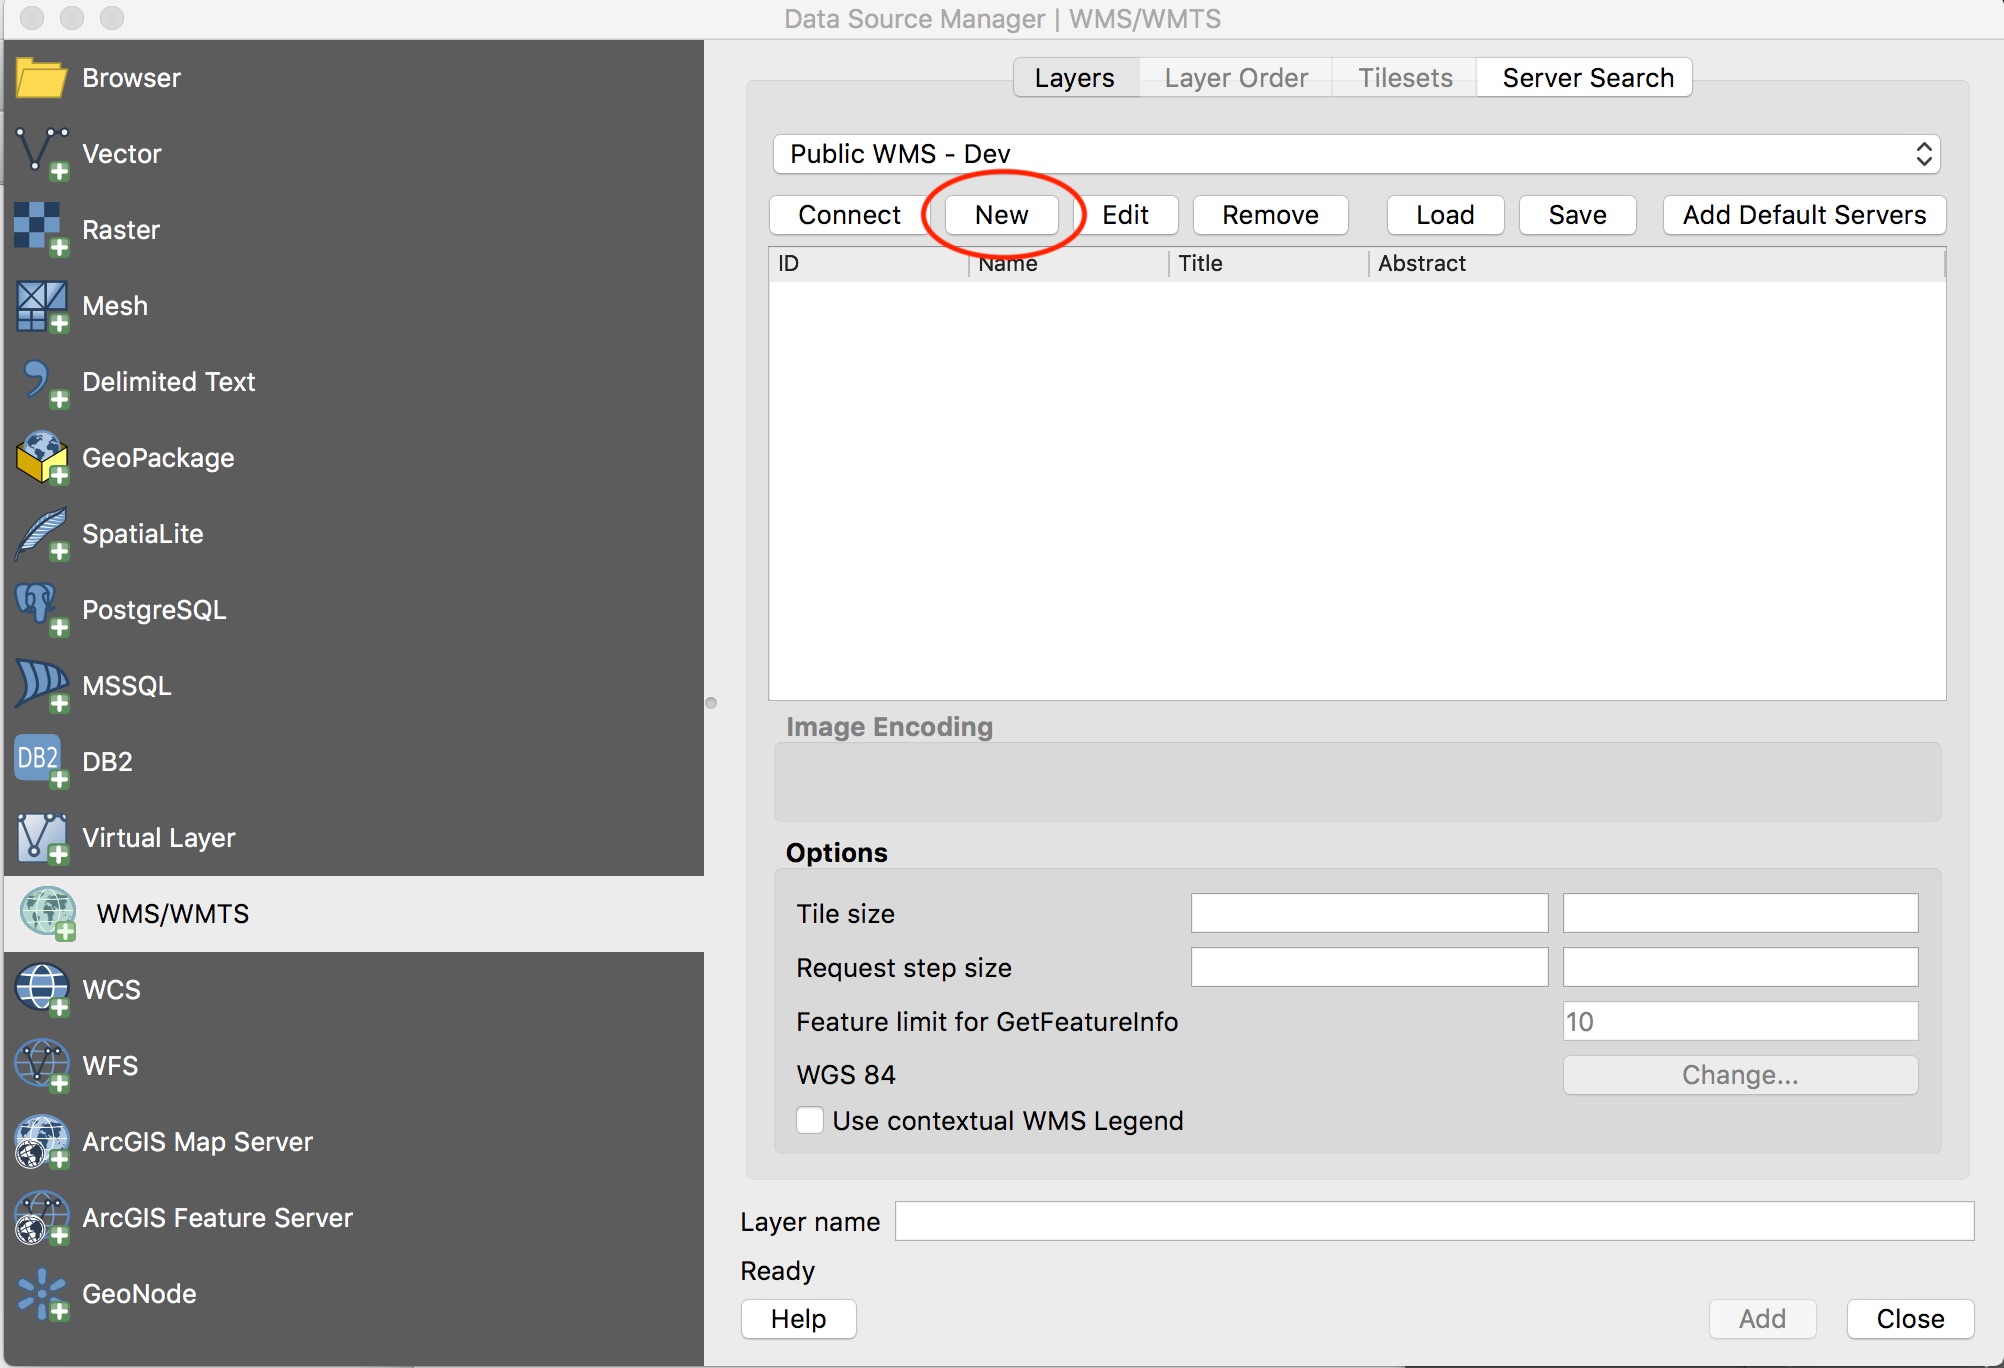
- From the resulting 'Data Source Manager' window, press the 'New' button to create a new connection.
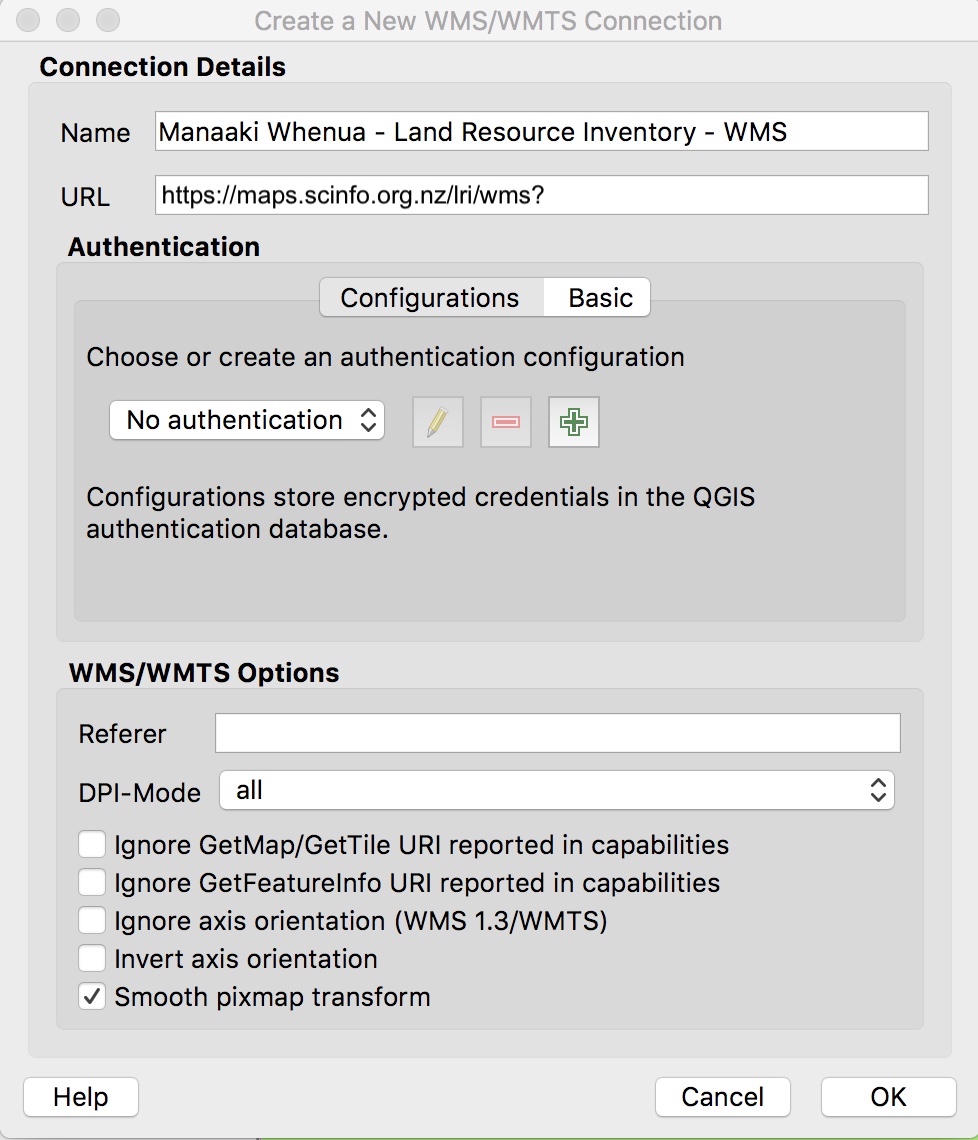
- Now enter the URL for the desired service, cached or uncached. All the service URLs can be found on the main page, however here are a few examples:
All cached maps - WMTS
Add a Name for your connection, check the 'Smooth pixmap transform' checkbox, then click 'OK'.Land Resource Inventory - WMS
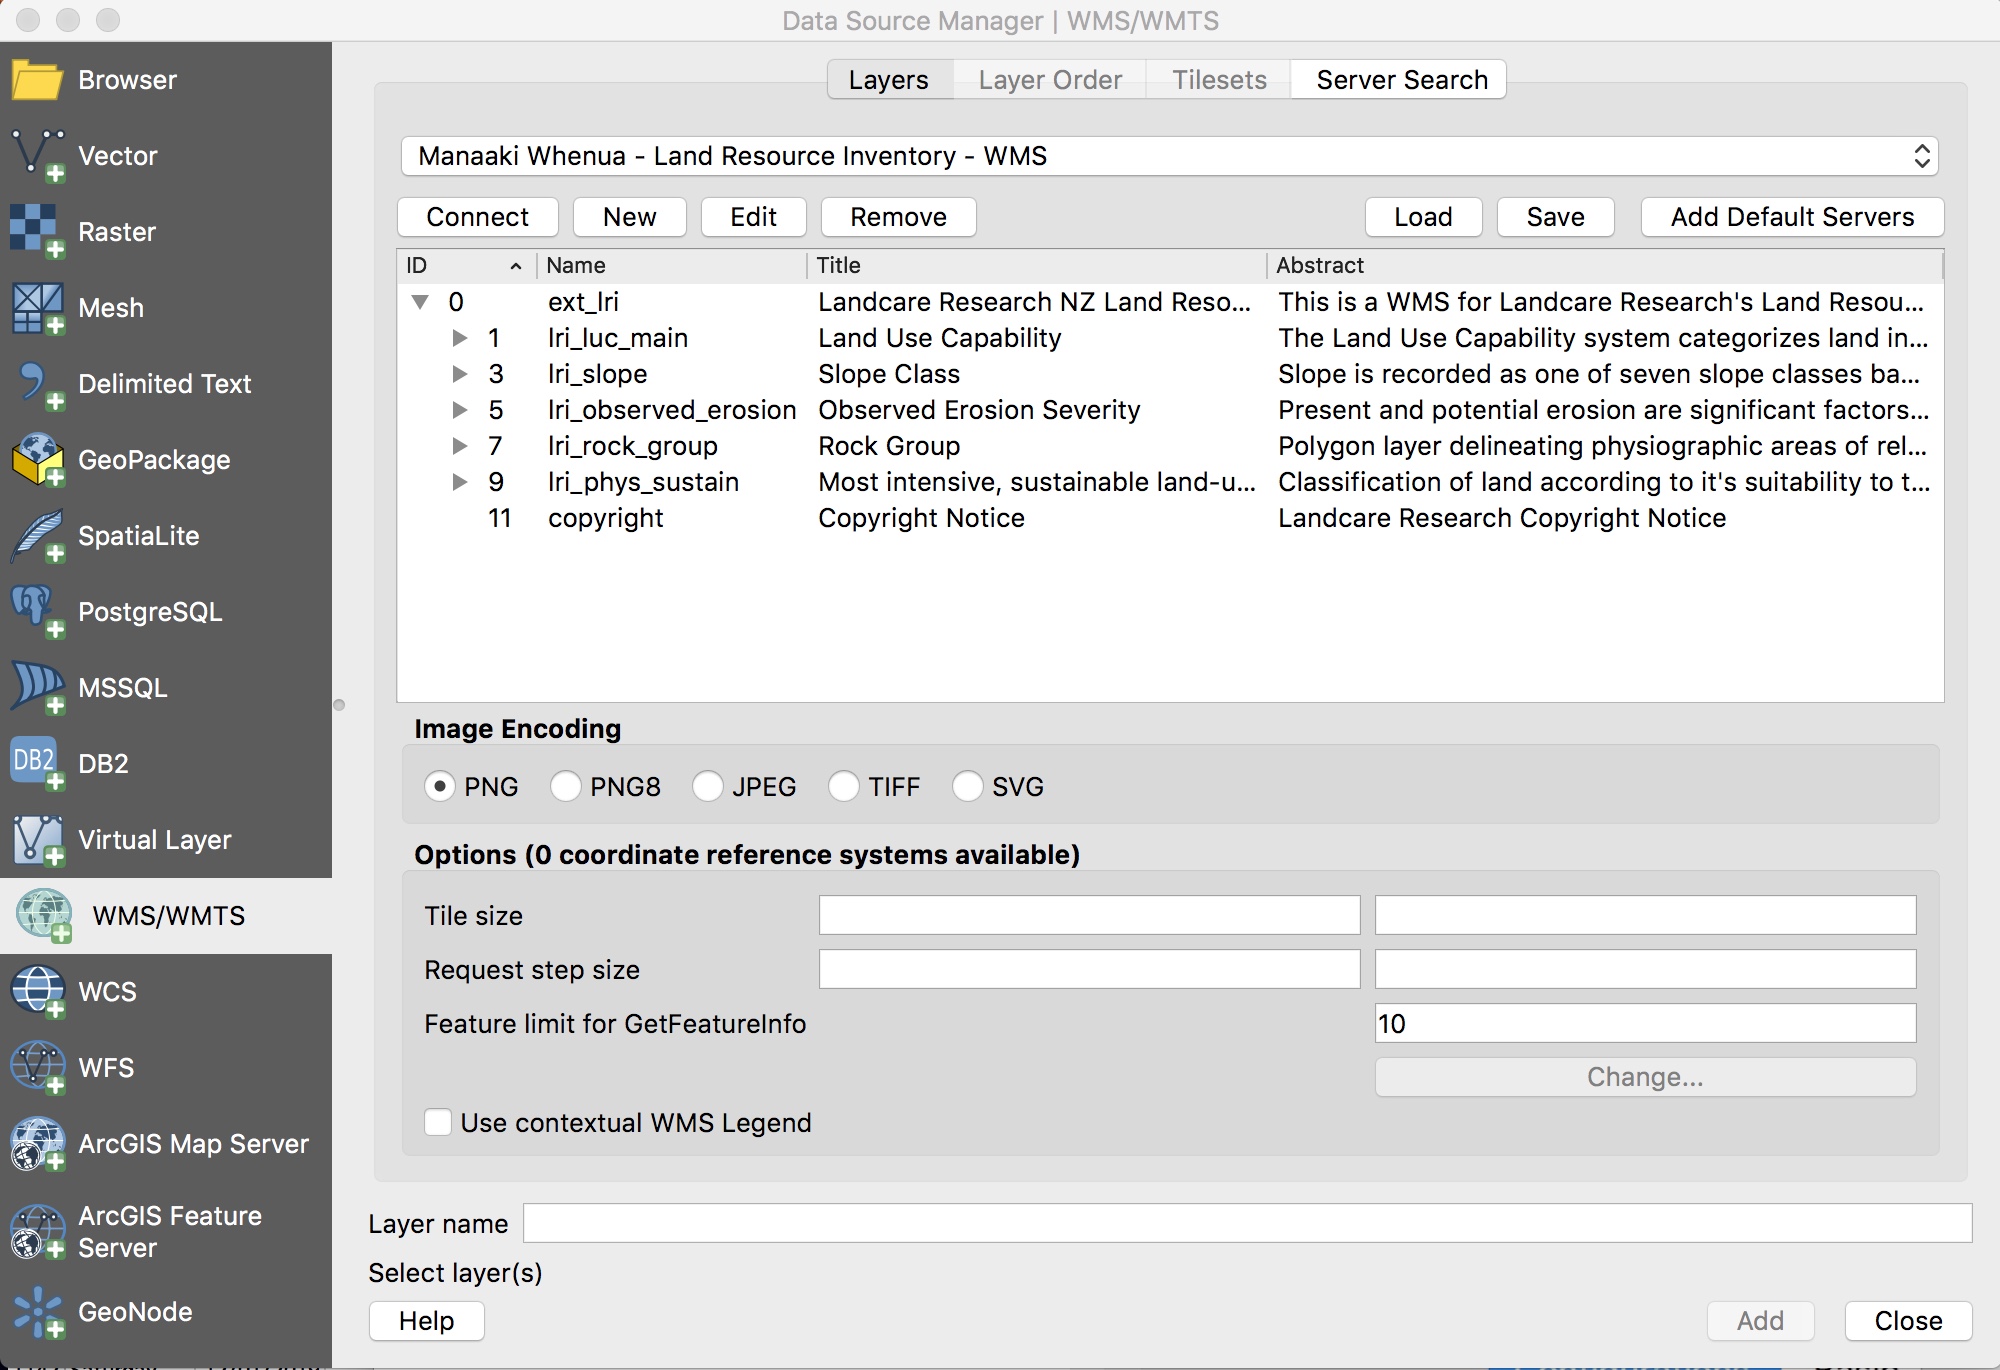
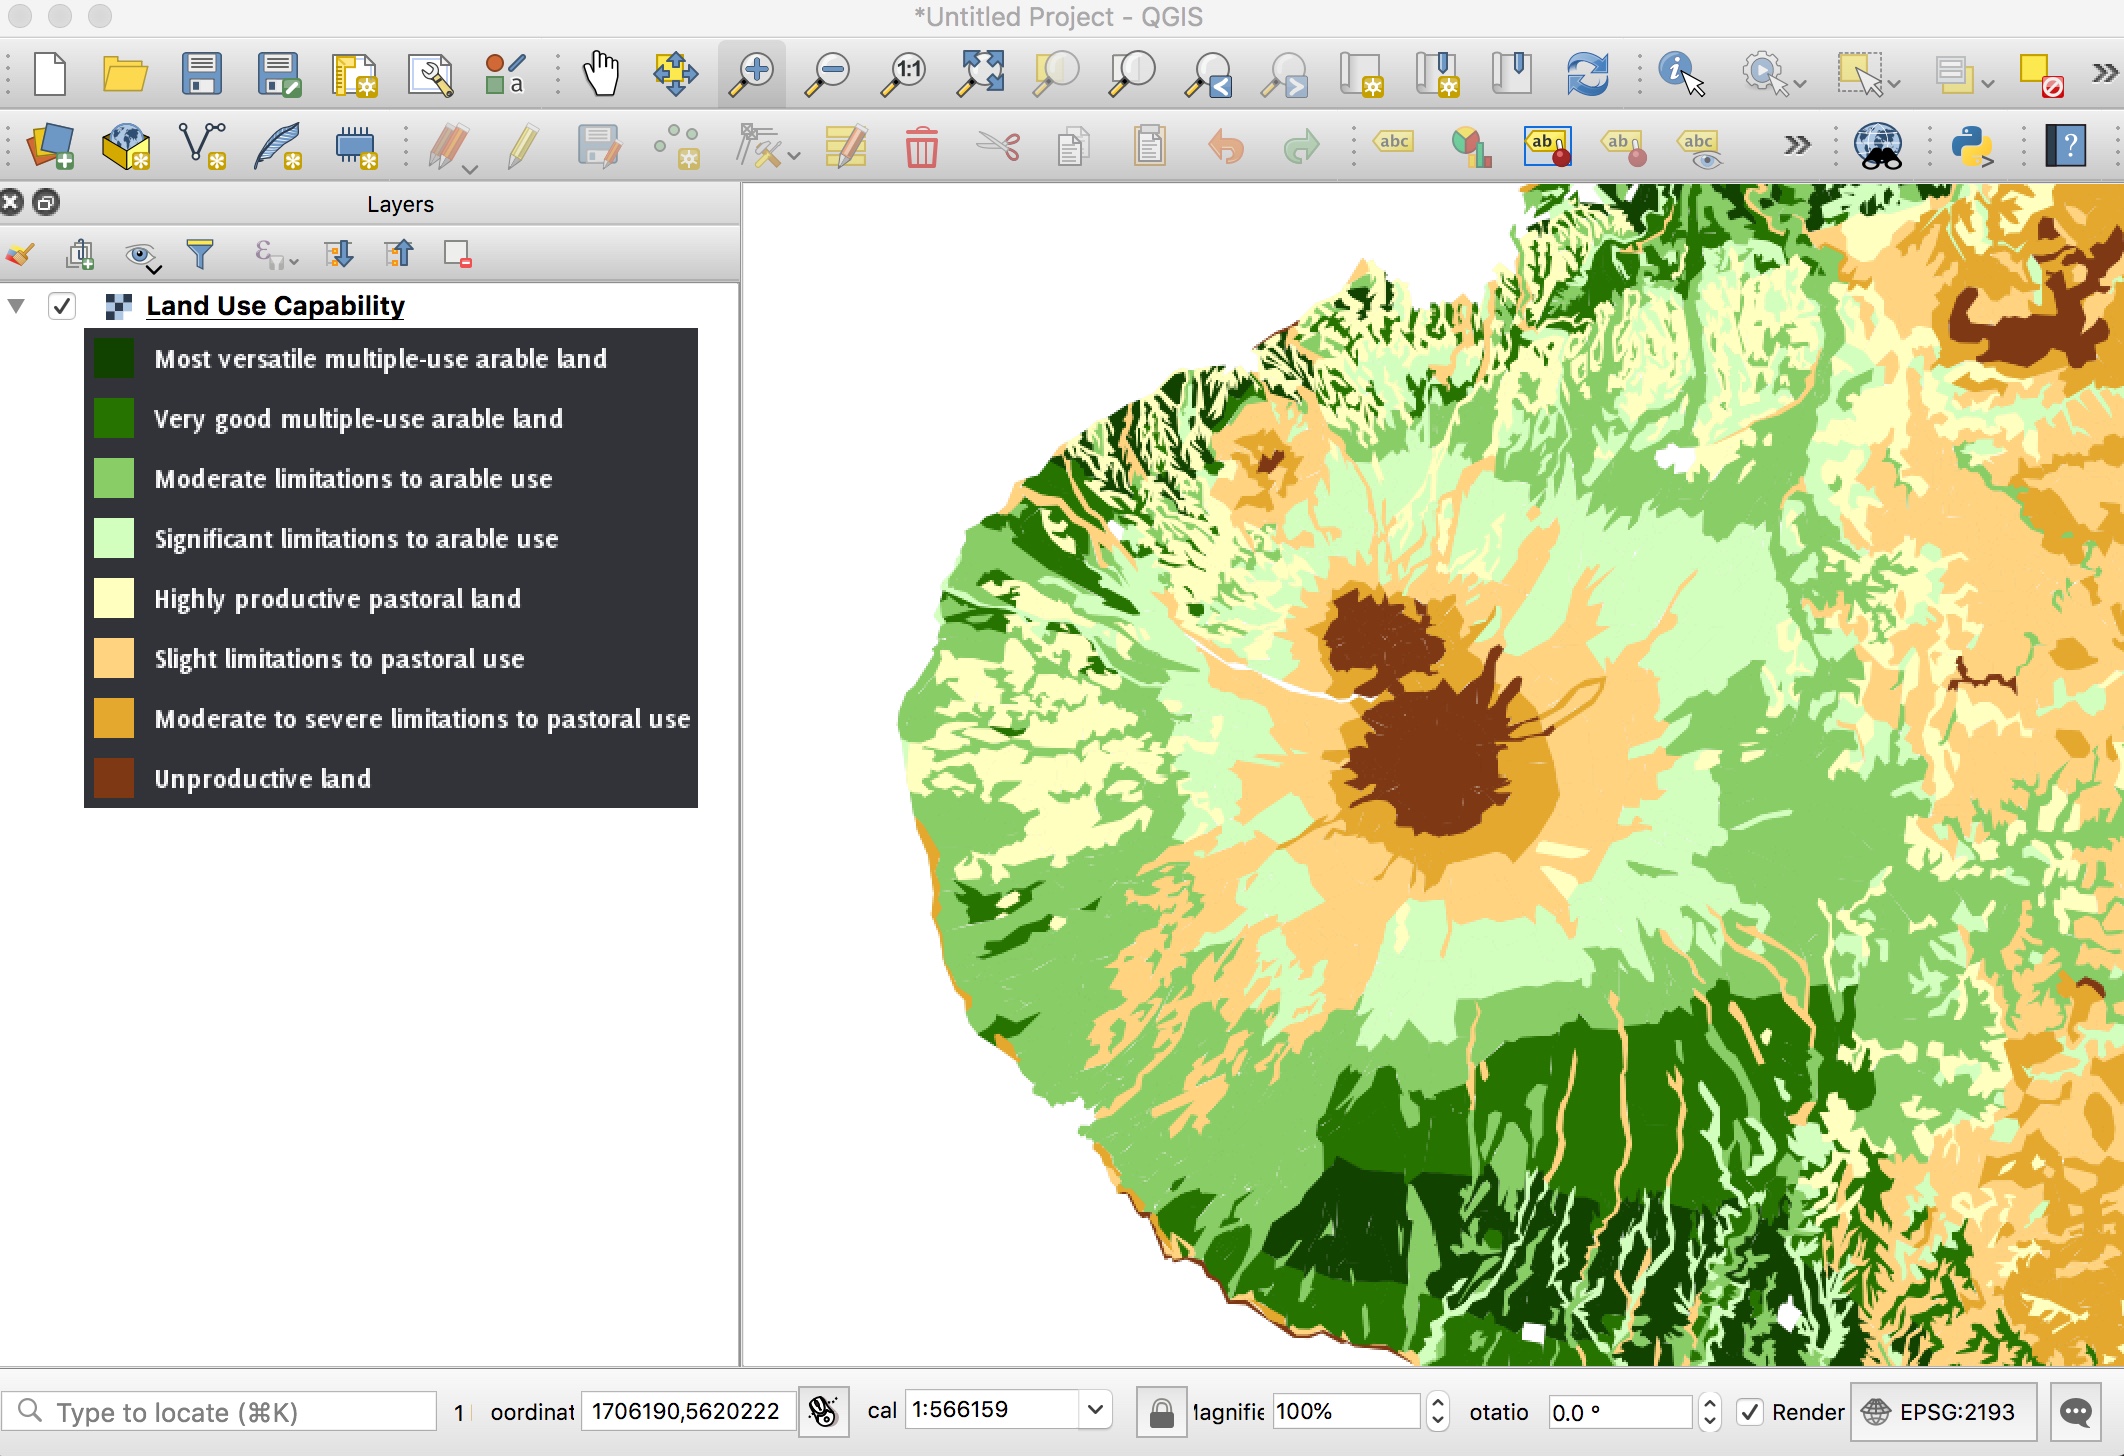
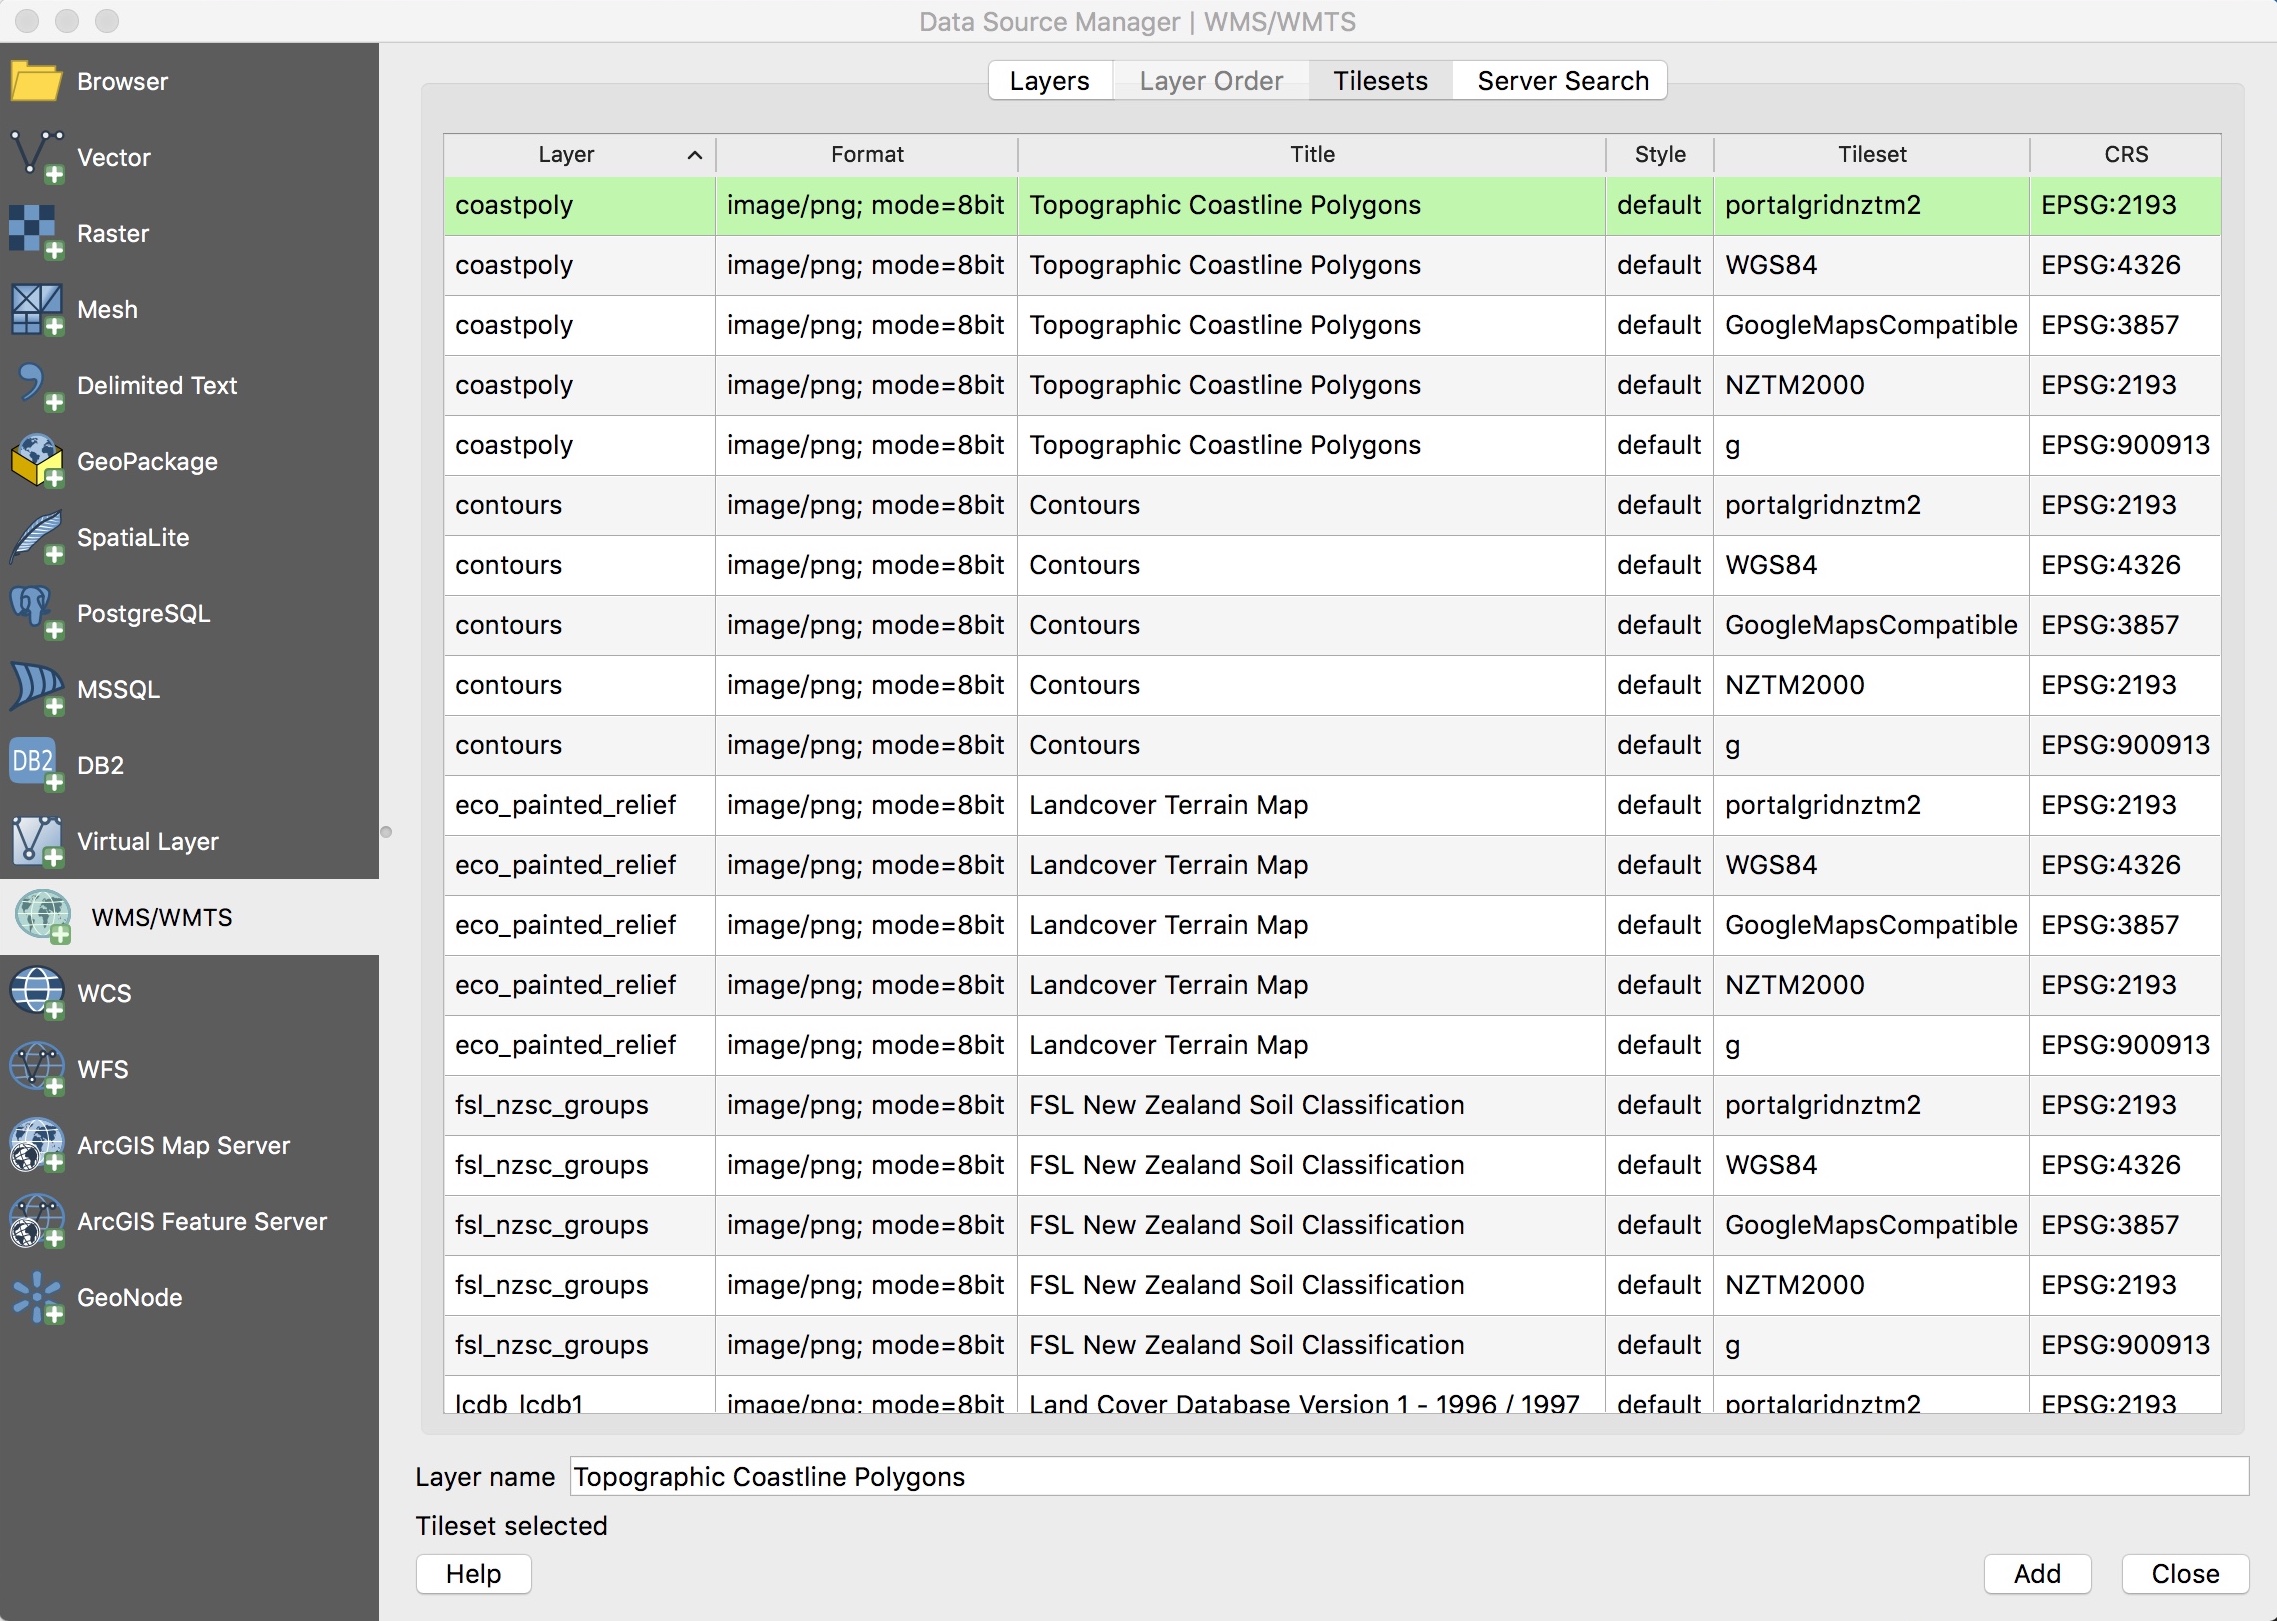
- You can now connect to the service by clicking the 'Connect' button. From here you can then choose the layer to be added to the map. Once the desired layer has been highlighted make sure the correct projection is chosen. If it is incorrect, click on the 'Change...' button and change to the desired projection. For the uncached WMS, you can choose from the supported projections (e.g. 'NZGD2000 / New Zealand Transverse Mercator 2000'). Make sure the 'Use contextual WMS Legend' box is unchecked. Once chosen, click 'Add'.
- Close the Data Source Manager window, and the map should load, with a legend added in the 'Layers' panel. N.B. Only WMS layers have legends supported.
- Step 3 is only required once per service. Once the WMS / WMTS has been added, it should remain in the drop down list of available connections in the 'Data Source Manager' window. Further layers can then be added to the map, taking care to choose the correct projection.
- For the best quality rendering, the WMS layers are recommended, especially for something like the cartographic text layer. This can have the side effect of slow drawing maps at small scales. Maps will be rendered quicker the further you zoom in.
- Connecting to the cached layers is carried out in the same way, but using the cached services WMTS URL, however layers will be added from the 'Tilesets' tab. Be aware that each layer is added multiple times, for each supported projection / tileset.
- Additional documentation on how to use QGIS can be found here.
All cached maps - WMTS
Copyright Label
- Select from menu
View ‣ Decorations ‣ Copyright Label. The dialog will open. - Make sure the Enable Copyright Label checkbox is checked.
- Enter the text / HTML you want to place on the map.
- Choose the placement of the label from the Placement combo box.
- You can refine the placement of the item by using the Horizontal and/or Vertical boxes.
- You can change the color to apply.
- Click [Apply] to verify that it looks as expected or [OK] if you’re satisfied.
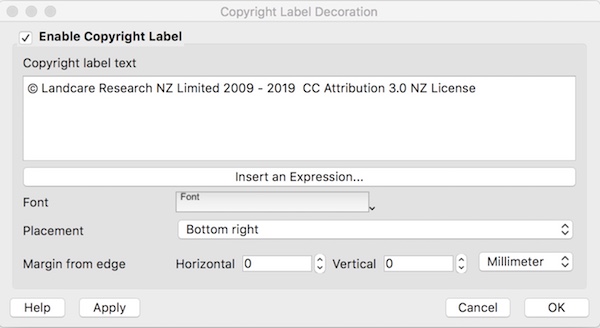
In the example above, which is the default, QGIS places a copyright symbol followed by the date in the lower right-hand corner of the map canvas.
ArcGIS
The following steps describe an example of how to add a Landcare Research WMS layer / cached map tile service layer into ArcGIS. There are pros and cons to each type of service - for instance at small scale, maps requested through the uncached services will take longer to render. On the other hand, the straight WMS map rendering should be crisp at any scale, whereas as the cached services have been built at specific zoom levels: maps in between these specific zoom levels may render slightly fuzzily, or the text may be too small. We would recommend experimenting to see what form best suits your needs. These instructions were created using ArcGIS version 10.0, but should work using versions > 9.
- Open a new ArcGIS document, and set the Data Frame's coordinate system.
- Right click on the 'Layers' in the Table of Contents
- Choose 'Properties', then navigate to the 'Coordinate System' tab
- In the 'Select a coordinate system' window at the bottom, expand the 'Predefined' folder, and navigate & choose: Predefined / Projected Coordinate Systems / National Grids / New Zealand / NZGD 2000 New Zealand Transverse Mercator
- Click OK
- If you plan on using the cached map tiles, it might be worth loading in the set of predefined scales, at which the cached tiles should work best at. To do this:
- Expand the scale dropdown menu and choose 'Customize This List'
- Can then either create the list manually using the set of scales found in this textfile, alternatively you can download that textfile and choose the 'Load' option, then 'From File...' in the Scale Settings window, then navigate to the downloaded file, to load in the custom scale set.
- If you go down this route be sure and check the 'Only display these scales when zooming' checkbox
- Click OK to get back to the main map window
- Expand the scale dropdown menu and choose 'Customize This List'
- Click the Add Data button

- Choose 'GIS Servers' from the 'Look in:' dropdown, then 'Add WMS Server', for uncached WMS maps, or 'Add WMTS Server' for cached maps.
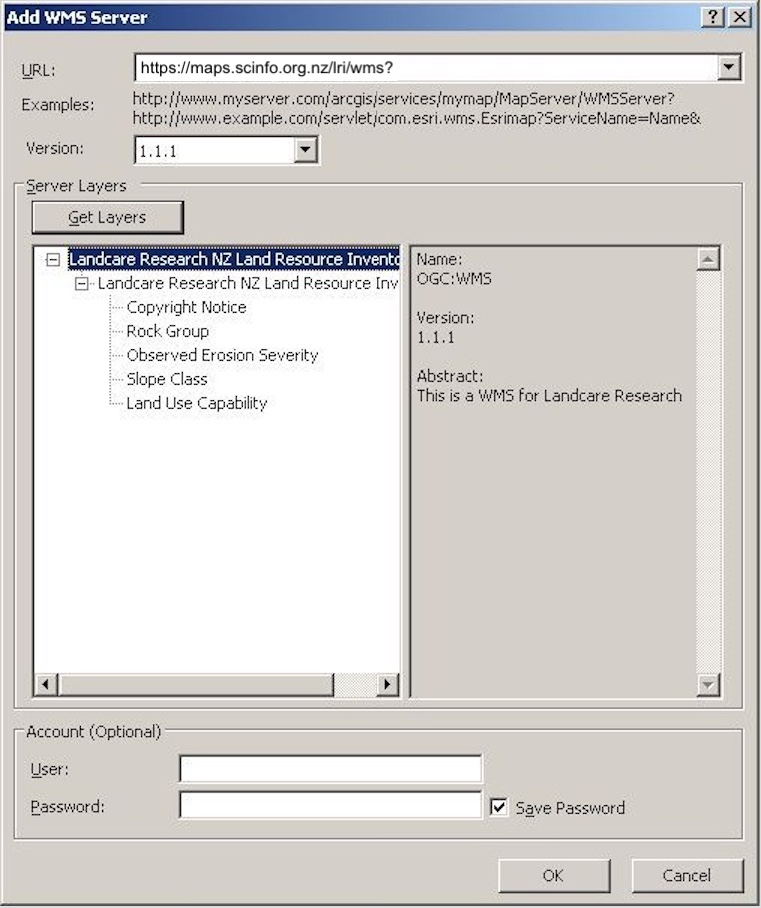
- In the window that appears, enter the URL for the desired service. All these URLs can be found on the main page, however here are a few examples:
WMS URL Examples
Uncached WMS
/lri/wms?
/basemaps/wms?
Cached WMTS
/cached/wmts?
- Change the Version to '1.1.1' (for WMS), or '1.0.0' (for WMTS) and click 'Get Layers'. The list of available layers should now be visible.
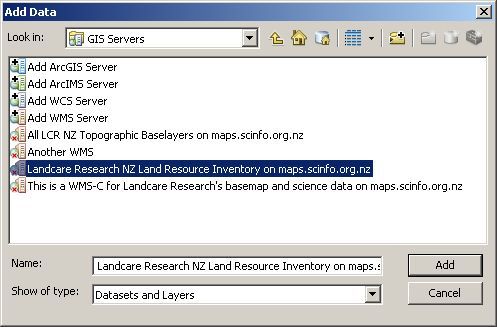
- Click OK This will add the WMS / WMTS to your available GIS Servers. It will be named slightly differently, dependent on the service, for example for the LRI, it will be 'Landcare Research NZ Land Resource Inventory on maps.scinfo.org.nz', or for the cached services: 'Landcare Research Public Cached Map Tile Service on maps.scinfo.org.nz'.
- The above steps are only required once per service. Once the WMS / WMTS has been added it should appear in your 'GIS Servers' section next time you open ArcGIS.
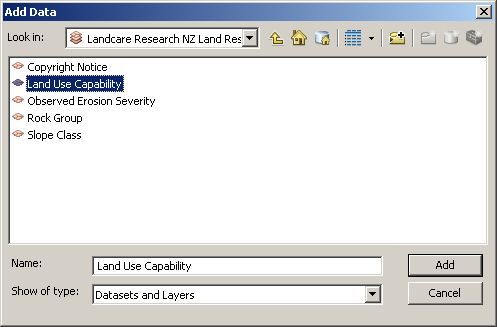
- To load a specific layer, navigate to it by double clicking on the newly created WMS / WMTS connection. You may have to double click on it additional times until you reach the list of available layers.
- Then choose the desired layer by double clicking on it, or click and press the 'Add' button.
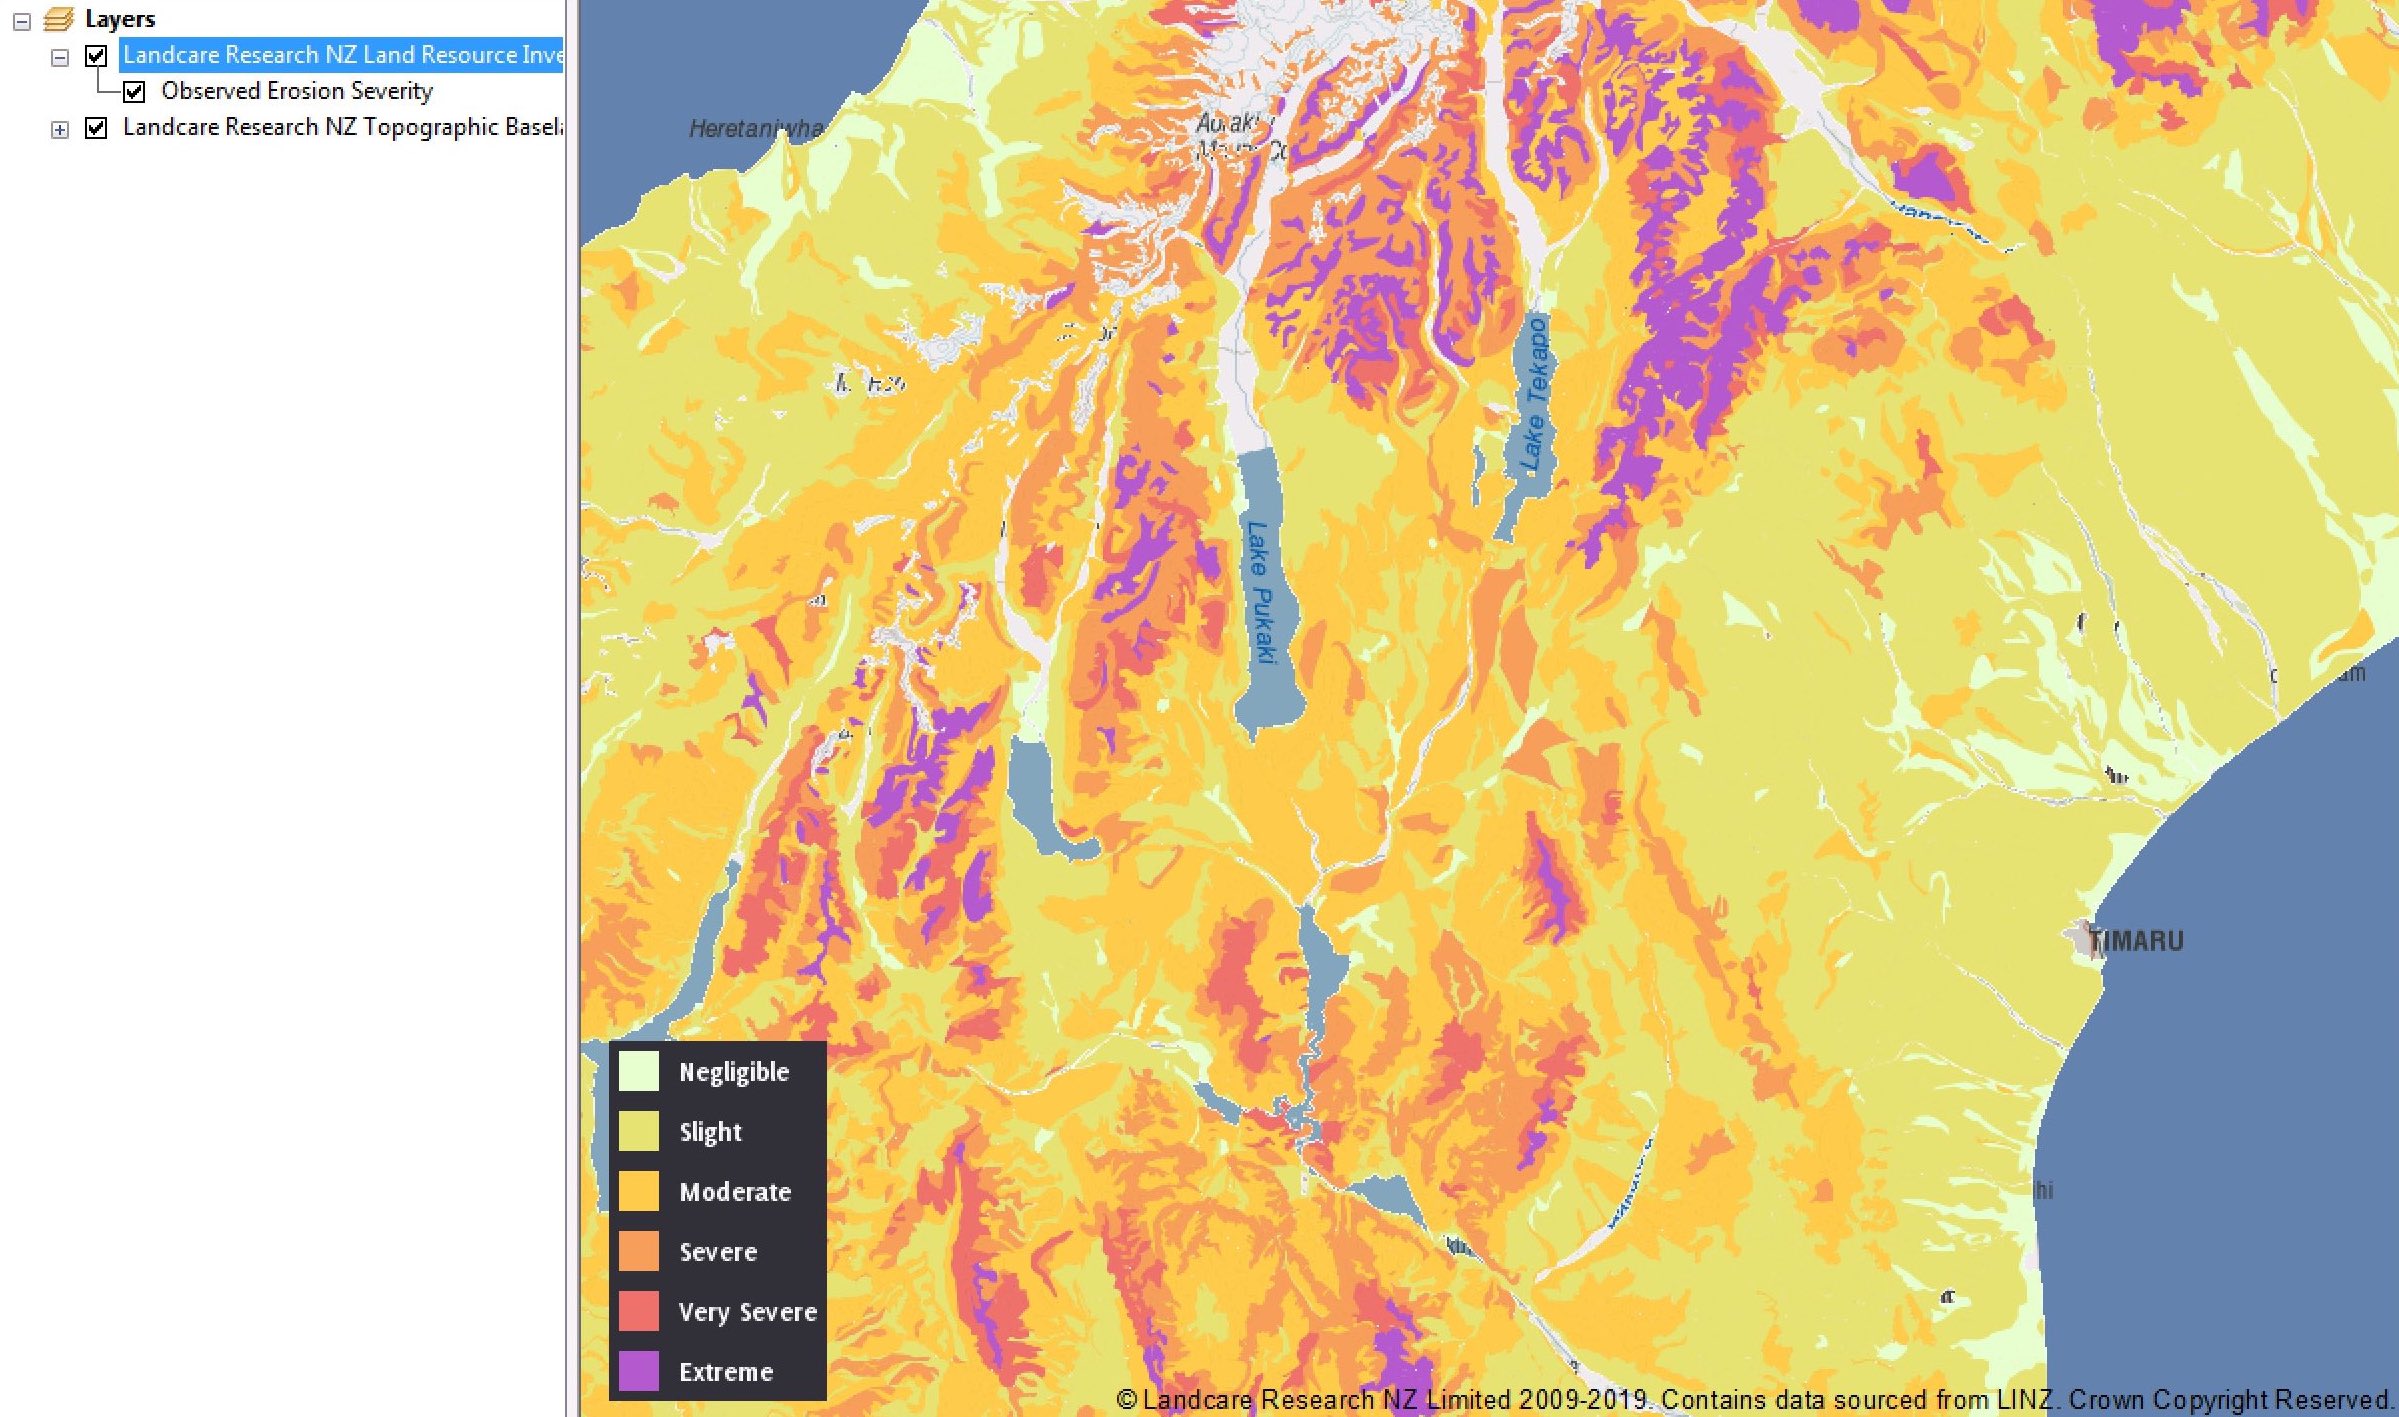
- For the WMS, you can add a legend to the map by right clicking on the layer in the TOC, and choose 'Add WMS Legend To Map'.
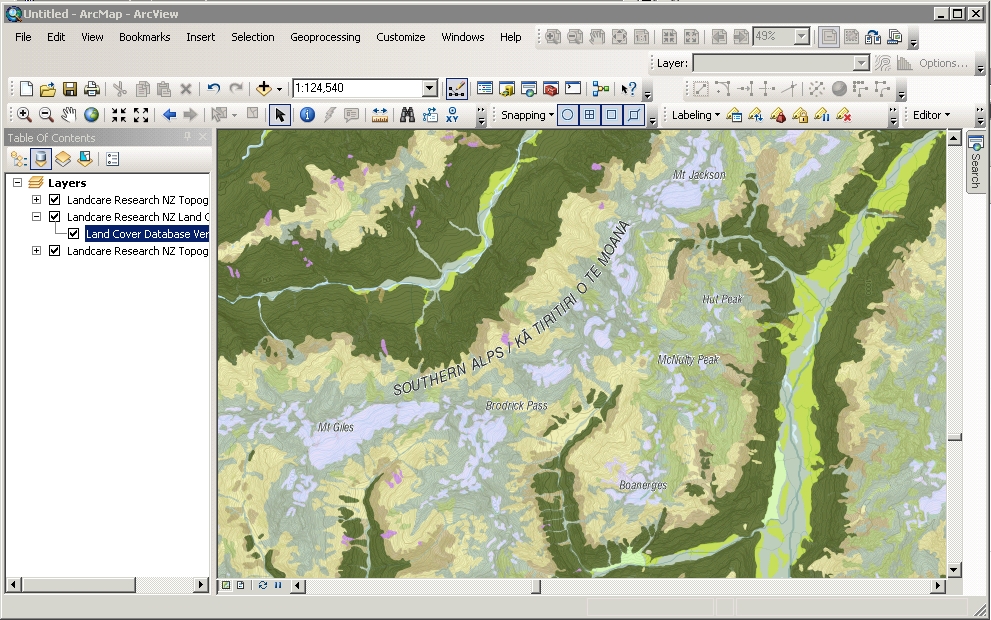
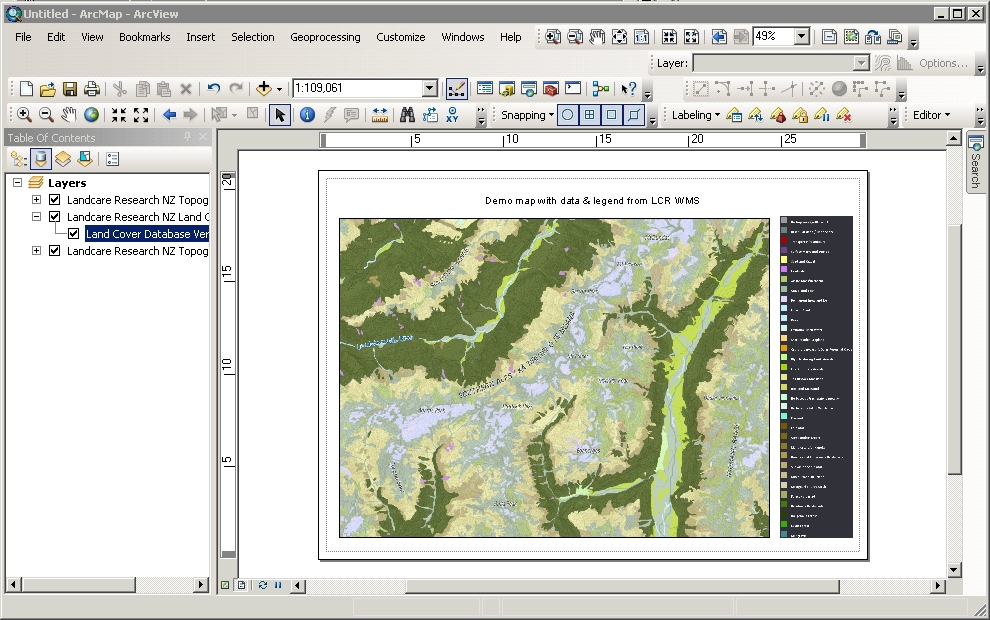
- Our map services can of course be combined with any other data sources, however below are a couple of screenshots that use only LCR WMS layers in an ArcMap project. The layers are the topographic basemap, LCDB3 and a cartographic text layer. The second screenshot shows the layout view, using the legend provided by the WMS.
- Additional documentation on using WMS within ArcGIS can be found here.
- Use cached map services if draw speed is important, potentially at the expense of some clarity of the map images. Use the 'raw' WMS if map images are required to be sharp.
- Rendering clarity issues are particularly noticeable on the cartographic text layer, for which we would recommend using the uncached, 'raw' WMS service.
- We have implemented some layers so that a map won't display at certain zoom scales. This is to prevent our data being used at inappropriate scales. Our science layers usually won't display at scales larger than 1:25,000.
- If no map is displayed, it may be due to incorrect projection settings or it may be that the request has timed out due to the volume of data requested. If this is the case, check the projection and try changing the scale to 1:500,000.
- If you get a map back but the colours look strange, it may be due to ArcMap's Raster options. They can be accessed through the 'Customize' menu, under 'ArcMap Options' in the 'Raster' tab. The 'Default RGB Band Combinations' should be '1','2','3' for 'Red','Green','Blue' respectively.
Now the project is slightly more customized for your needs, you can now set up the connection(s) to the Web Map Services:
ArcMap may display a 'Geographic Coordinate Systems Warning' message, it is safe to ignore this.
Hints and Potential Issues
With uDig desktop GIS
uDig is an open source desktop application framework, built with Eclipse Rich Client technology. Both our uncached & cached services work with uDig. However, for best quality rendering you need to change the default 'Basic WMS Renderer' format type order. This accessed from uDig preferences -> Rendering -> Basic WMS Render. Move image/png8 & image/png to the top. To add a layer:
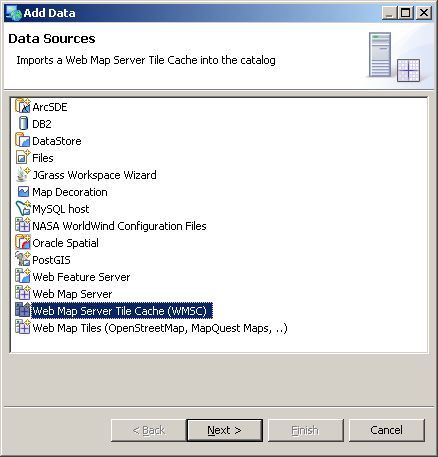
- Open uDig, and from the 'Layer' menu choose 'Add...'.
- From the resulting window, choose either 'Web Map Server' (to use our uncached service) or 'Web Map Server Tile Cache (WMSC)' (to access our cached service). Then click 'Next'.
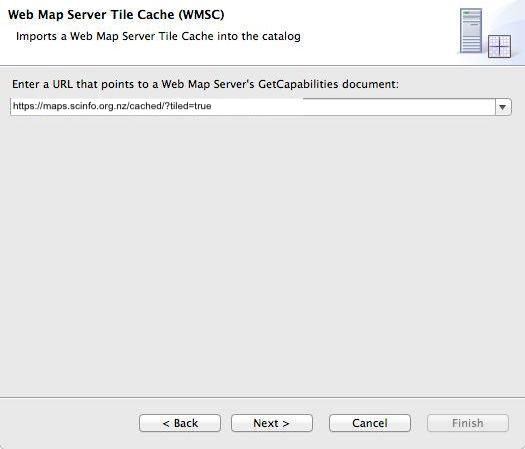
- Now enter the URL for the desired service, e.g. for our uncached LRI WMS, the URL to enter would be: 'https://maps.scinfo.org.nz/lri/wms?'. Accessing the cached service requires an additional parameter, 'tiled=true' added to the cached service URL, so it would be: 'https://maps.scinfo.org.nz/cached/?tiled=true', then click 'Next'.
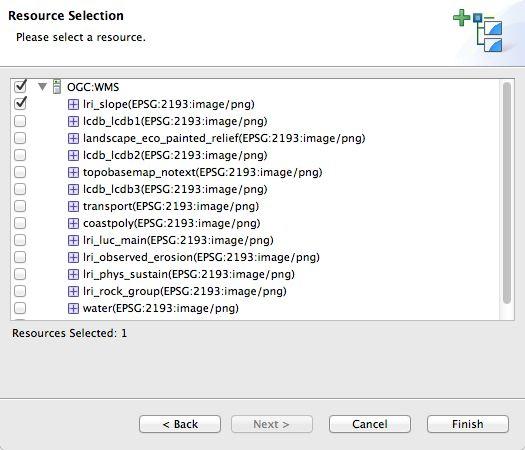
- You can then choose the layer / resource to be added to the map. Once chosen, click 'Finish'.
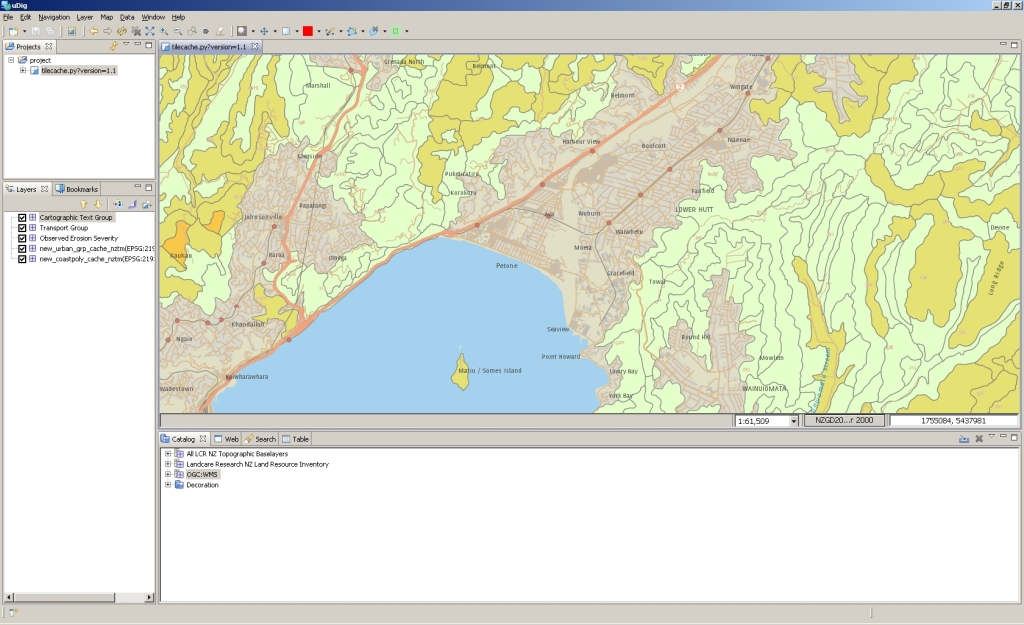
- The above steps are only required once. Once the WMS has been added it should remain in your 'Catalog' tab in the bottom panel. Further layers can then be added to the map.
- Additional documentation on how to use uDig can be found here.